What is at stake when we can't 'opt out'? Digital Out-of-Home (DOOH) advertising screens, embedded in public space and coordinated through algorithms, location and timing, extract behavioural and movement data, captured as eye-counts. They turn the city streets into a marketplace for the attention economy, with no possibility of consent.
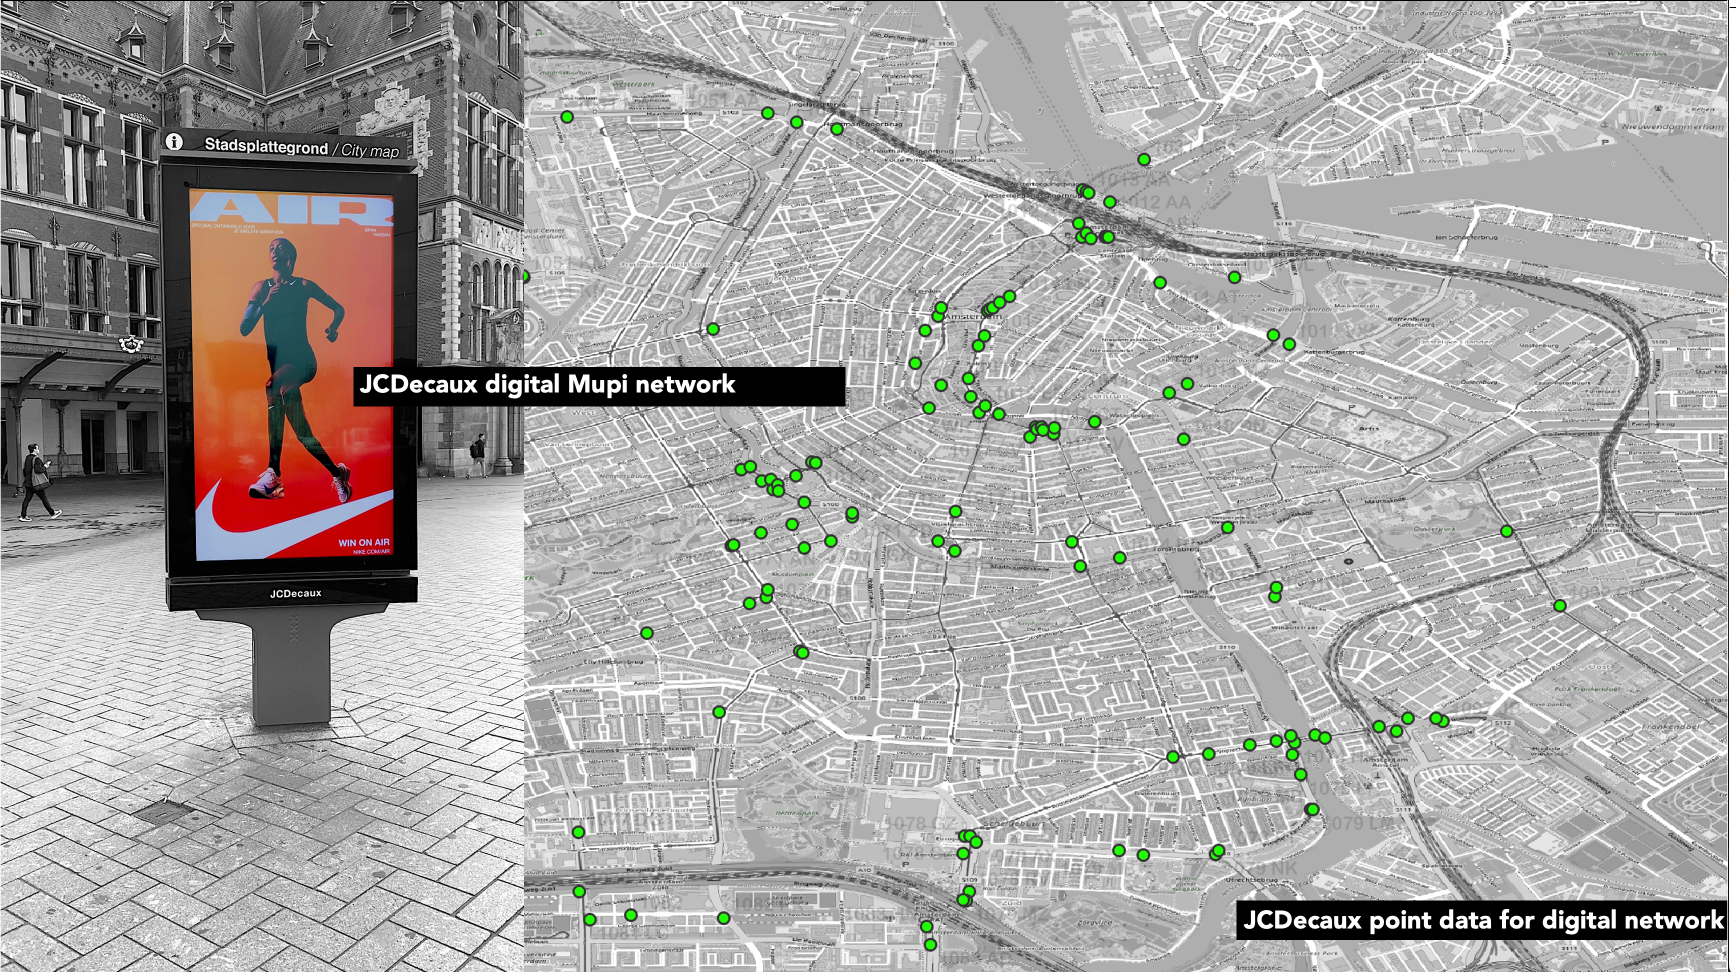
Cities on Loop is an artistic research project that deconstructs DOOH's apparatus directly, through technographic and embodied methods, mapping its operation and variability across Amsterdam before restaging it as an encounter. Slowing its six-second image loop reveals its tracking capacity and invites audiences to interrupt and negotiate its operational logic. By materialising these usually invisible processes, 'opting out' is staged as a bodily choreography of interruption: a collective, physical negotiation with an ambient infrastructure that was not built to be refused. The work destabilises DOOH's own affective strategies of illumination, repetition and sequencing.
The project is linked to the themes and insights developed in "A Glitch in the System" and "Infrastructures for Objection and Participation," activated in collaboration with Ro Pérez Gayo and expands upon my engagement with a critical spatial practice that analyses systems of representation and orientation.
The academic research strand of Cities on Loop develops over the course of four years as part of my PhD research trajectory with the Amsterdam School for Cultural Analysis (ASCA) University of Amsterdam, and is supervised by Professor Stefania Milan, and Dr Davide Beraldo
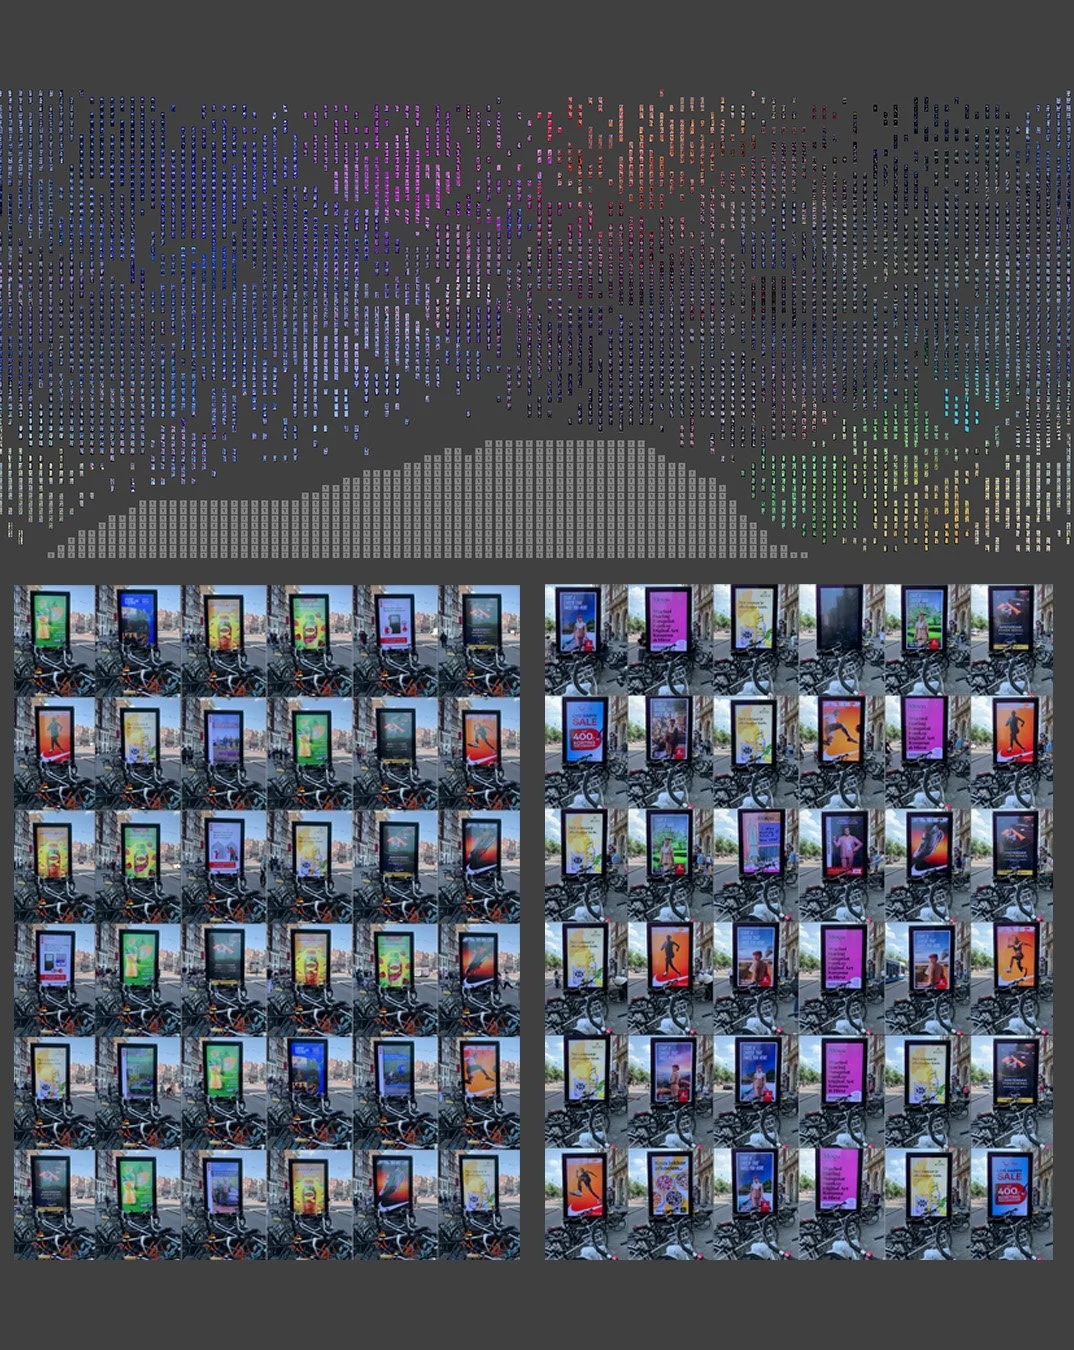
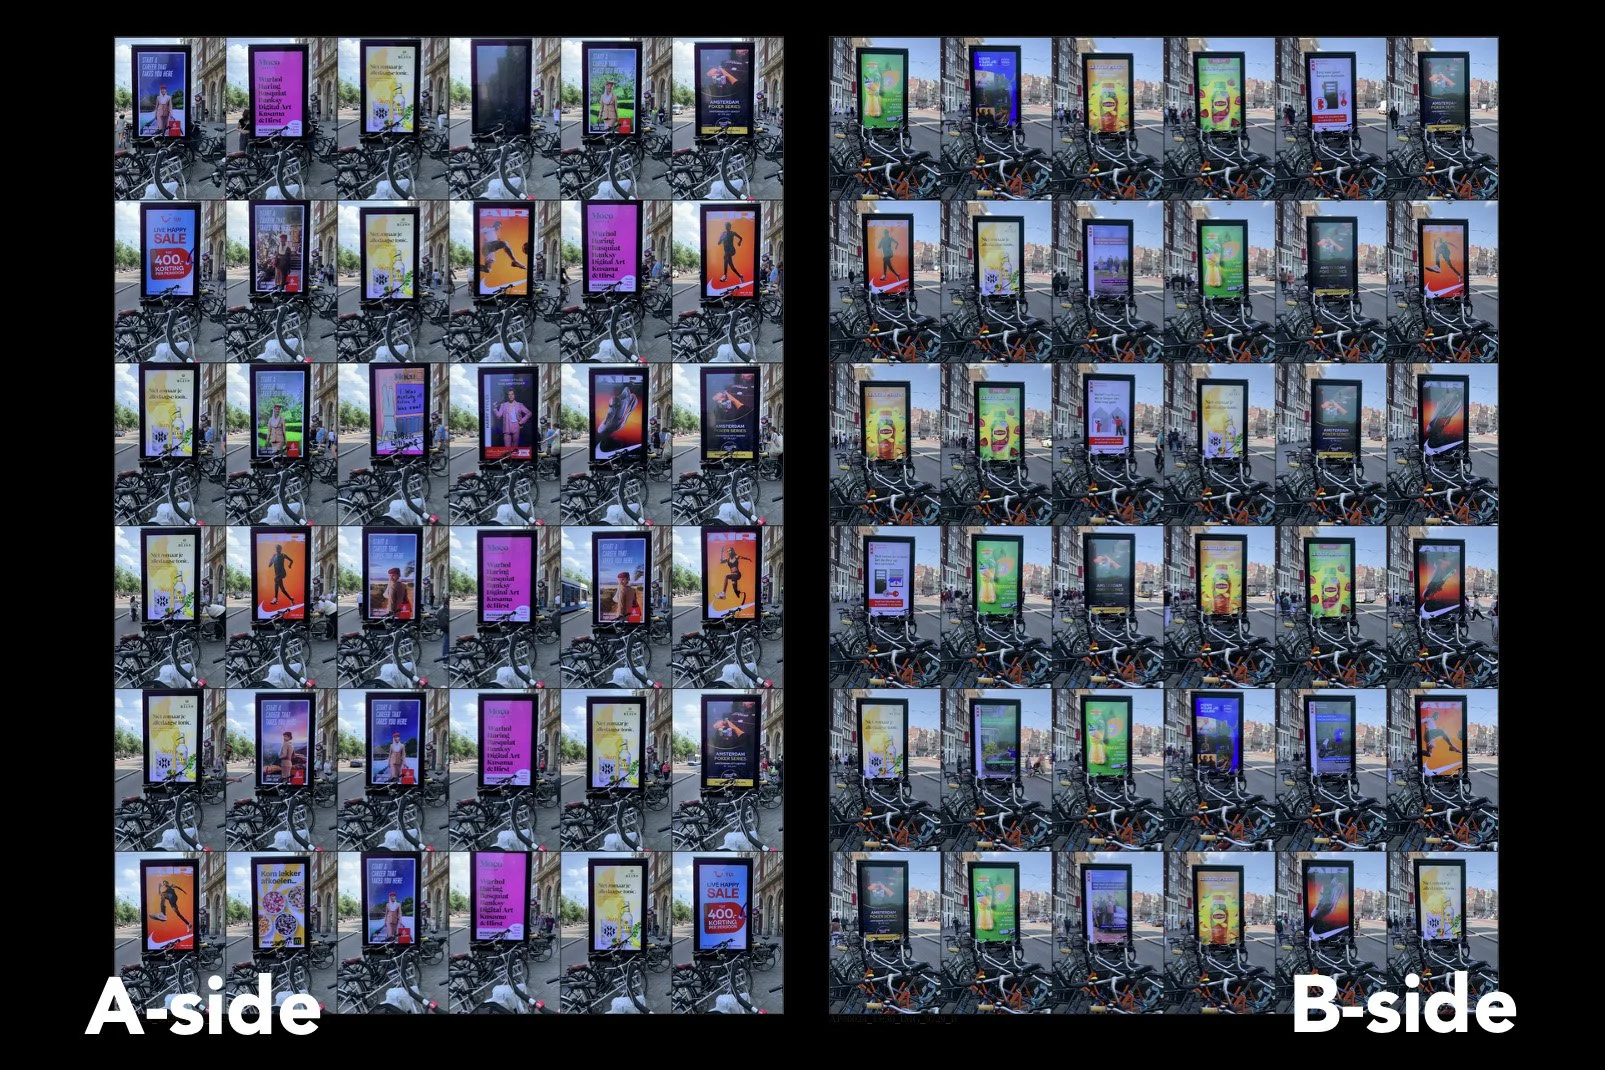
The visual mapping process extracted image stills at 6-second intervals, matching each ad's industry-defined spot length, isolating every ad play within its loop sequence. Six stills capture one complete content loop; mapping both sides of each digital object (Mupi) produced 36 ad plays per side. Across the data collection period this yielded 4,320 ad plays in total, revealing the temporal structure, sequencing and repetition behind DOOH's scheduling and programming logic.
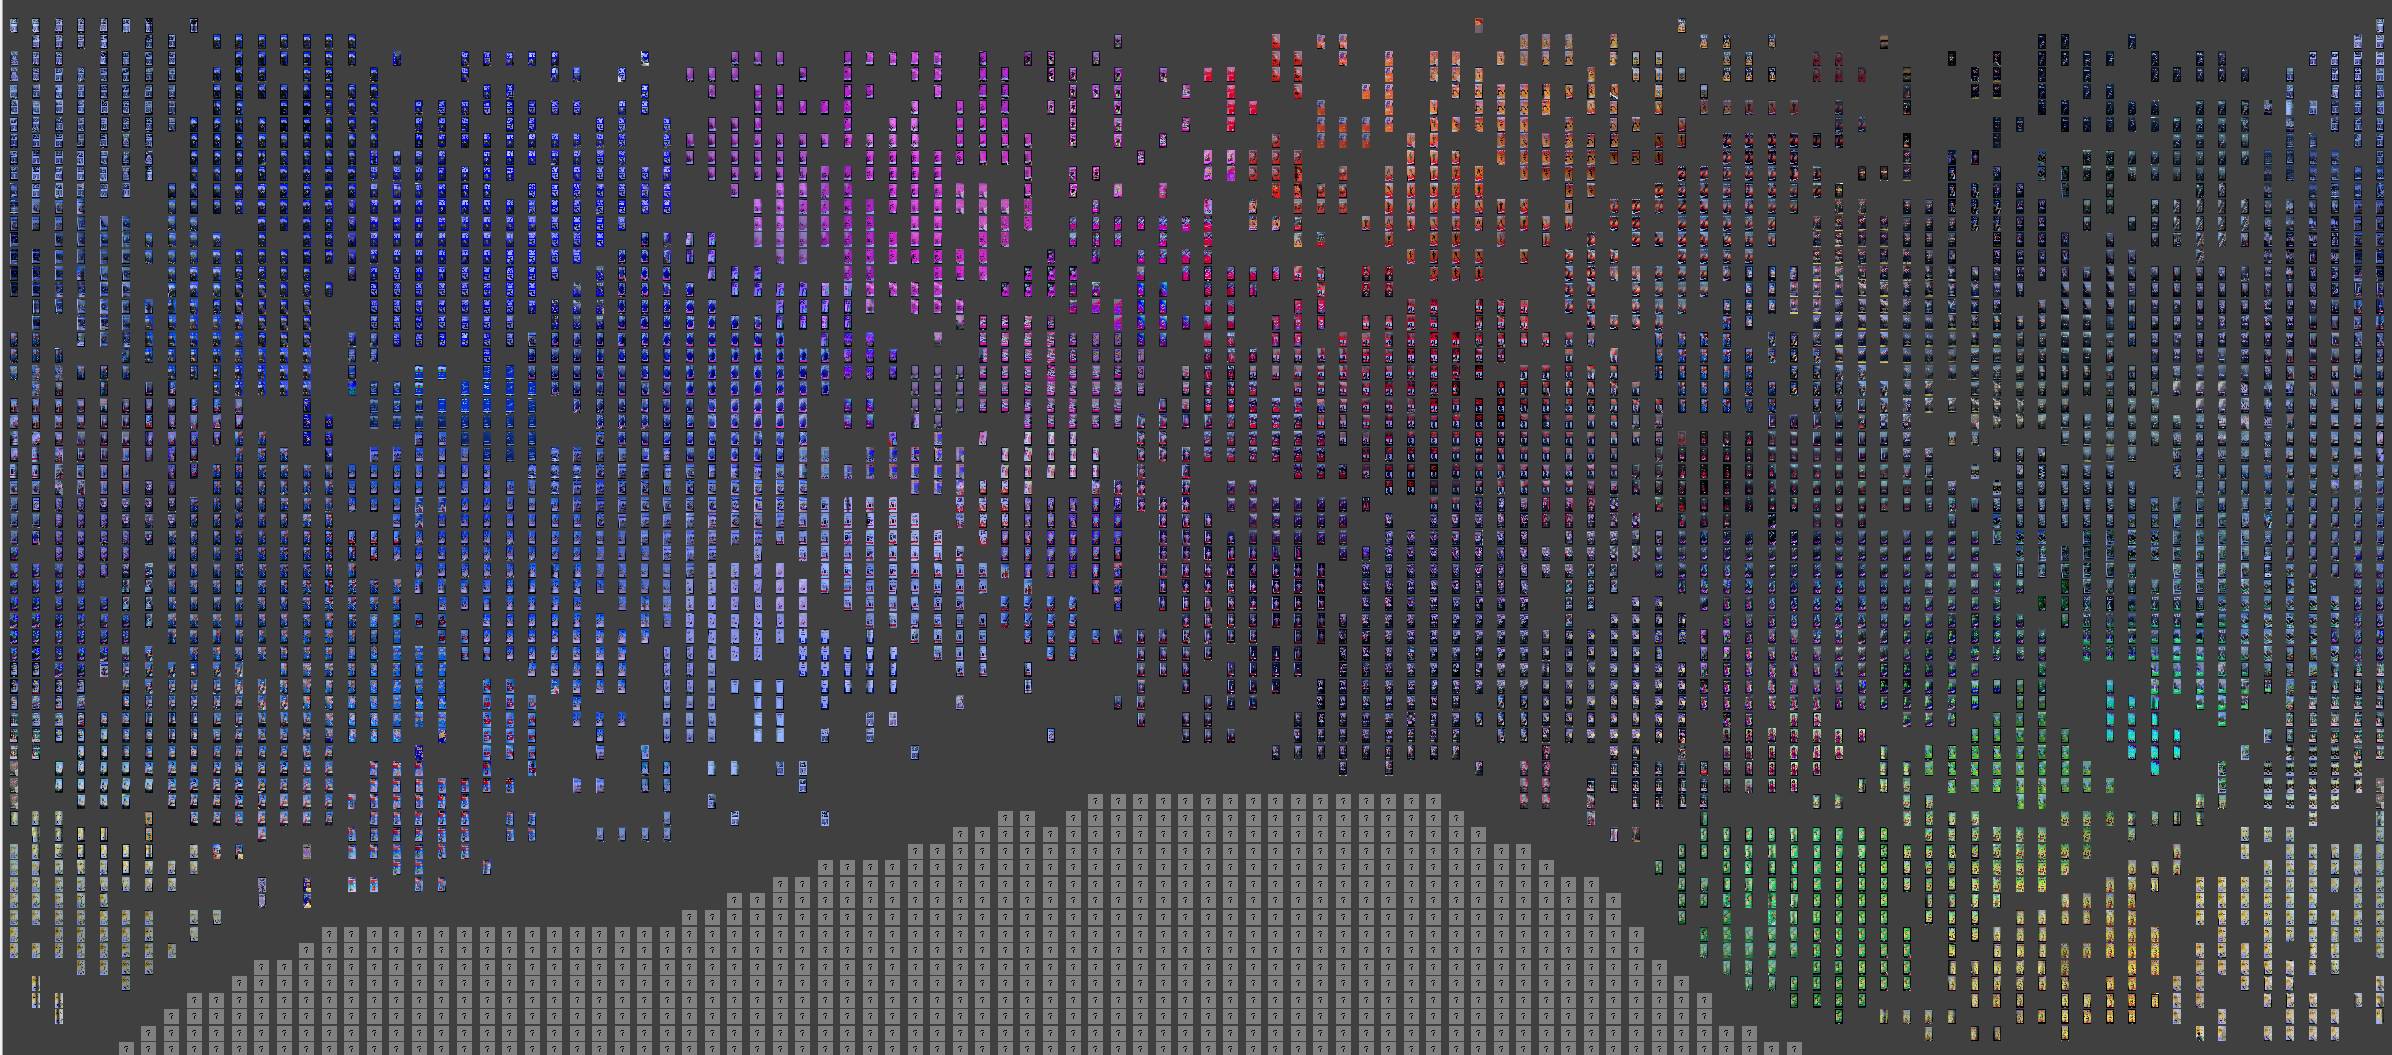
The frequency of each ad’s repetition across different interfaces was tracked. The frequency of unique ads was computed using a custom-made Python script, based on a combination of image perceptual hashing and DBSCAN (Density-Based Spatial Clustering of Applications with Noise). This technique enables to cluster visually similar (yet, not perfectly identical) images by hashing their content and grouping dense hash regions without requiring a predefined number of clusters.
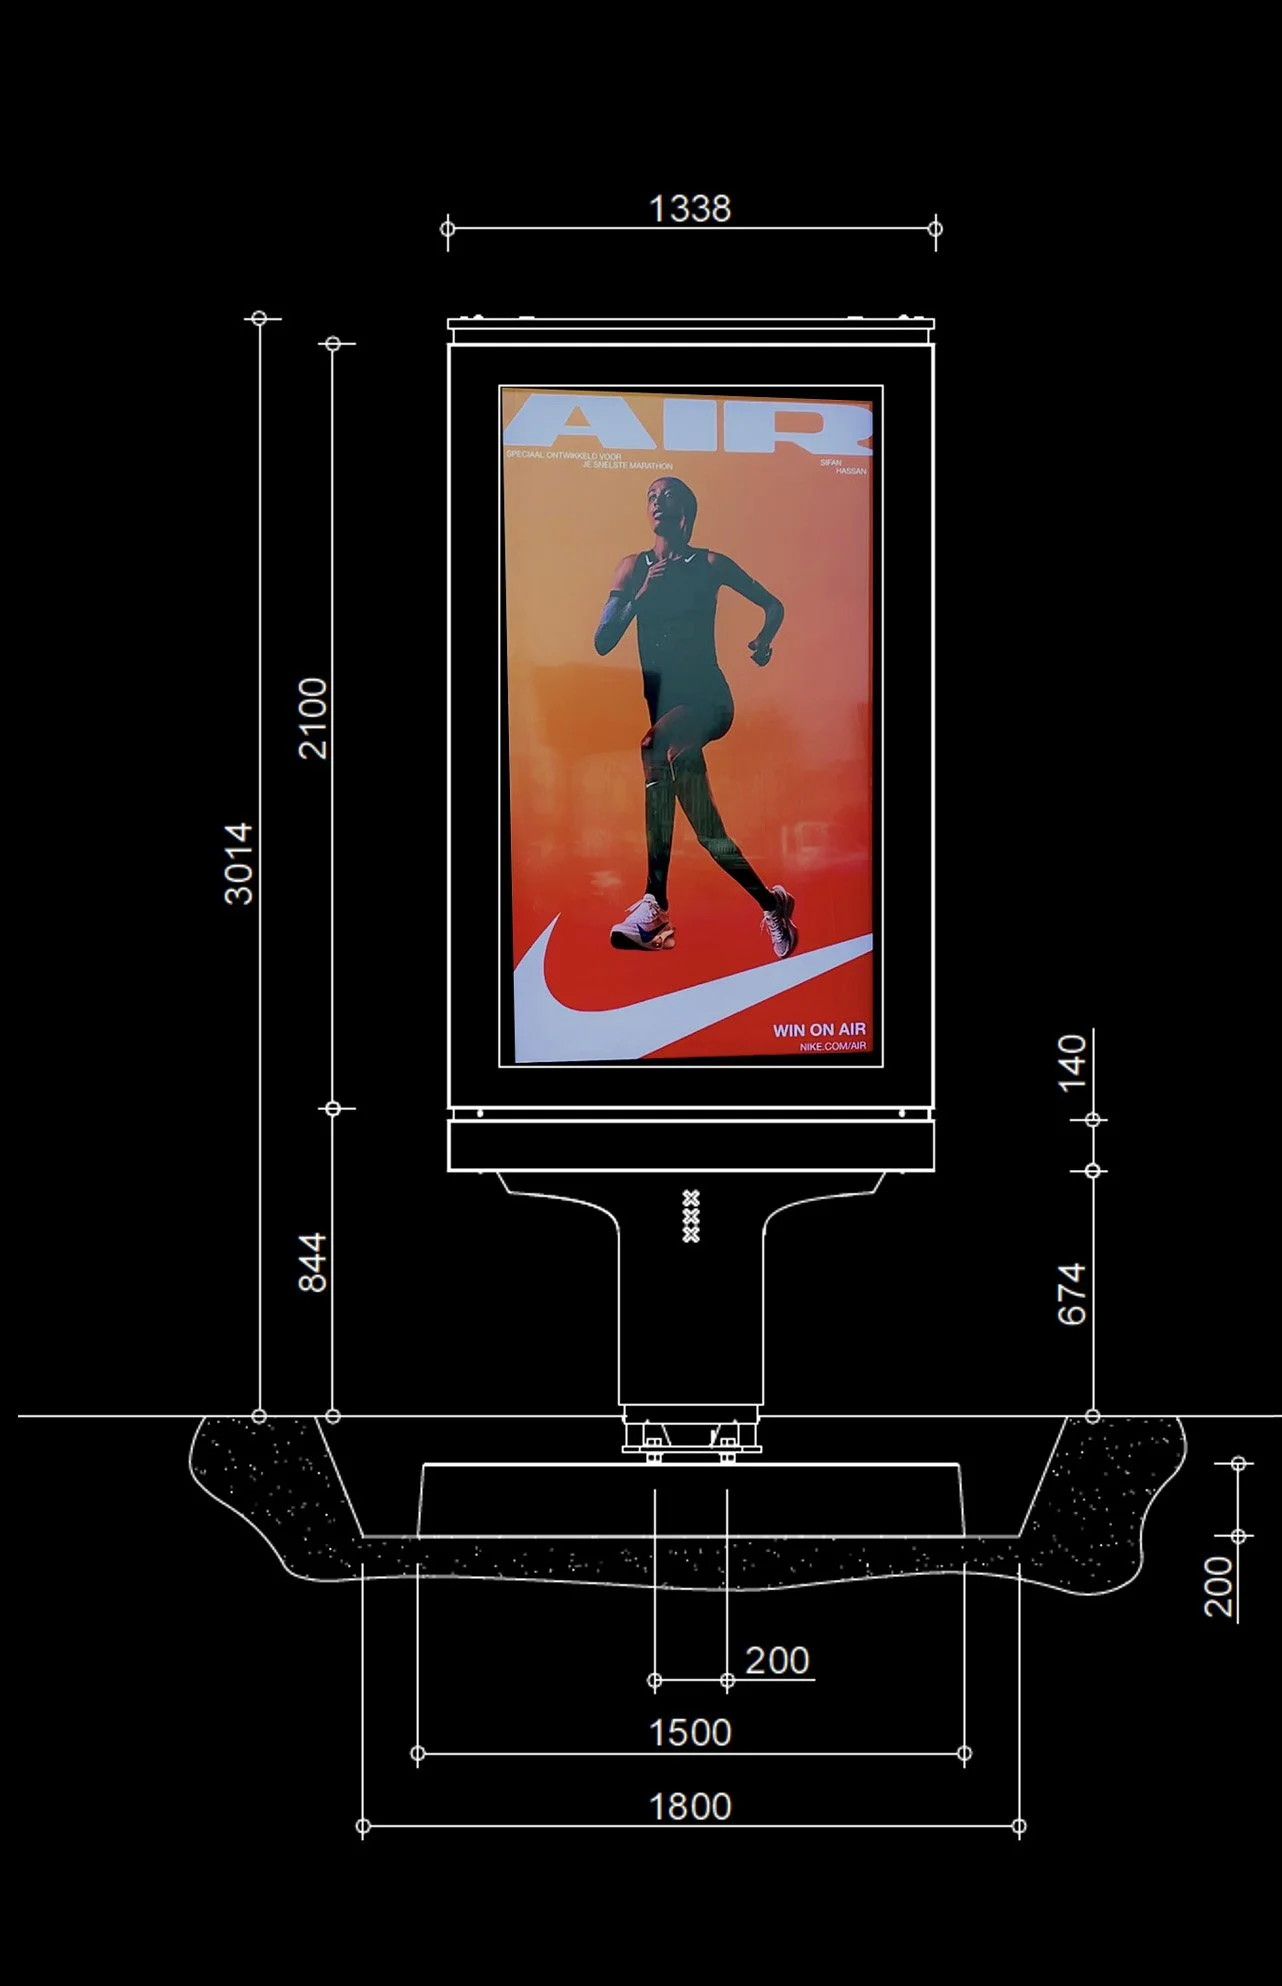
Mupis operates on a 36-second loop that displays a series of advertisements, each lasting six seconds. This loop sequence determines what is referred to in industry terms as the share-of-view (SOV): the proportion of total loop time allocated to a given advertisement.
Location #1: Amsterdam Centraal Station. Object number: NL—DD—00358. A-side and B-side six-second loop sequence
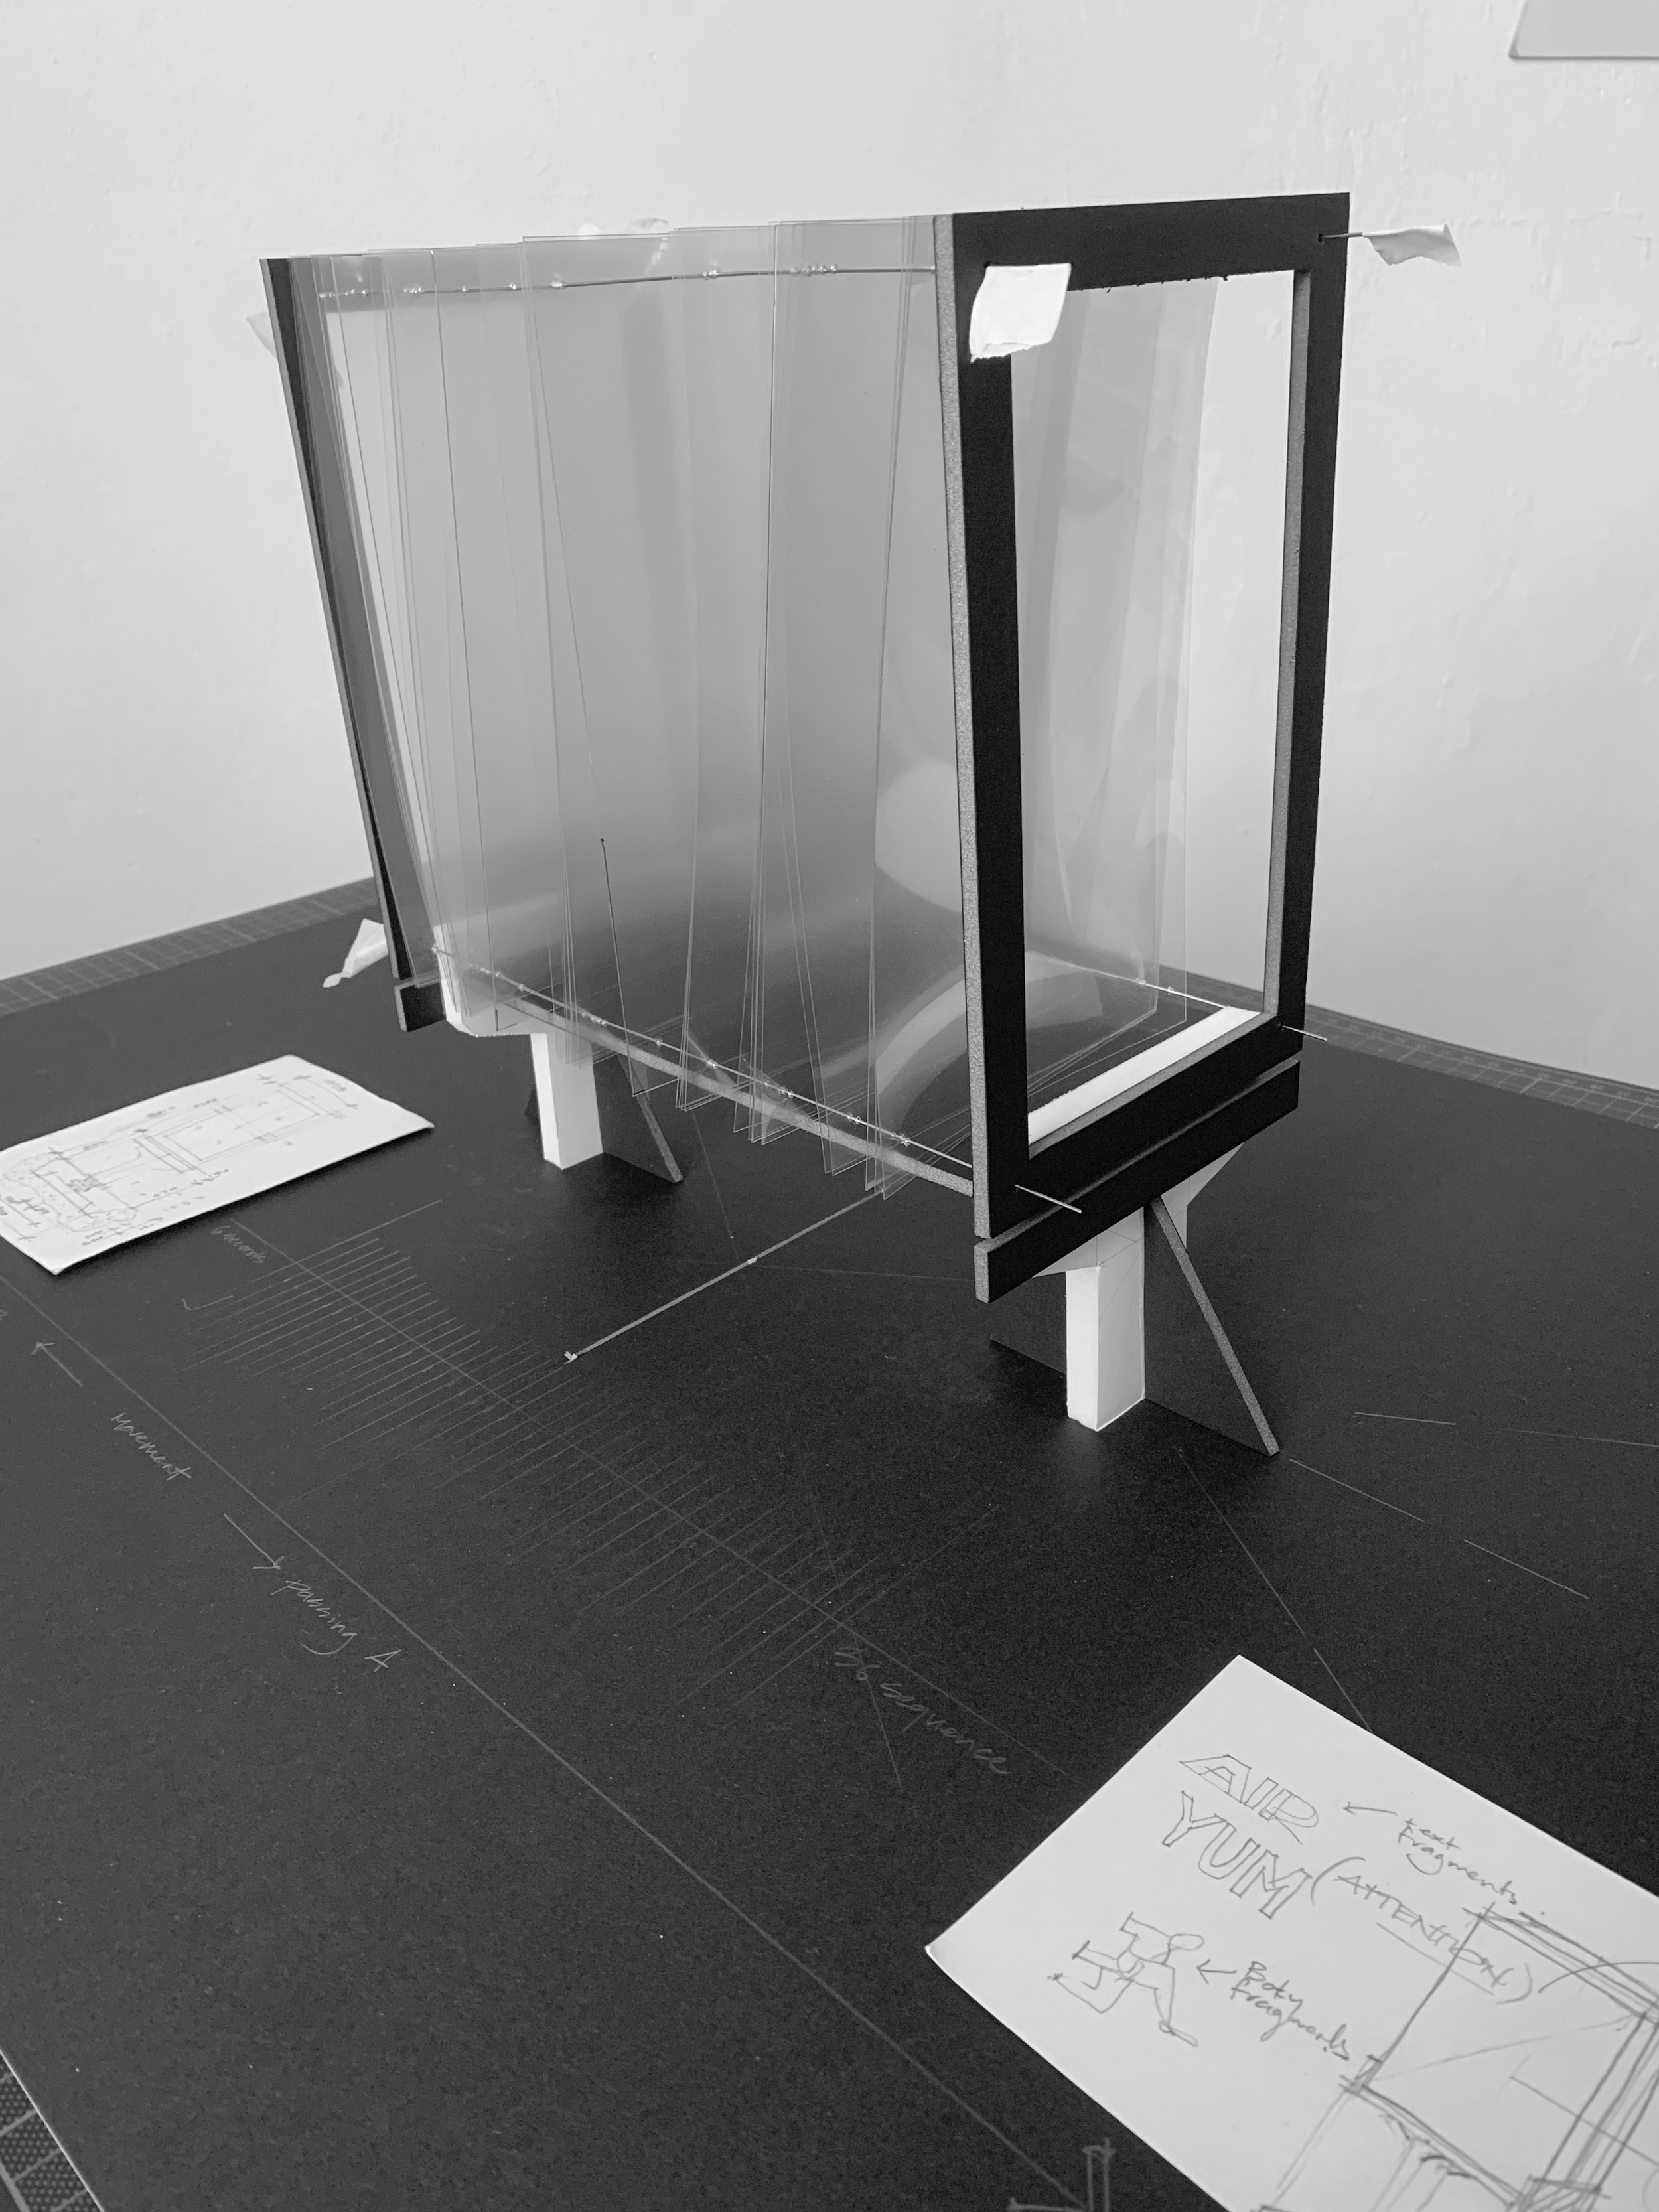
1:10 scale conceptual model.
Cities off Loop, a companion installation currently in development, using 1:1 modelling of DOOH interfaces, and material experimentation to make DOOH’s usually invisible operations physically encounterable.
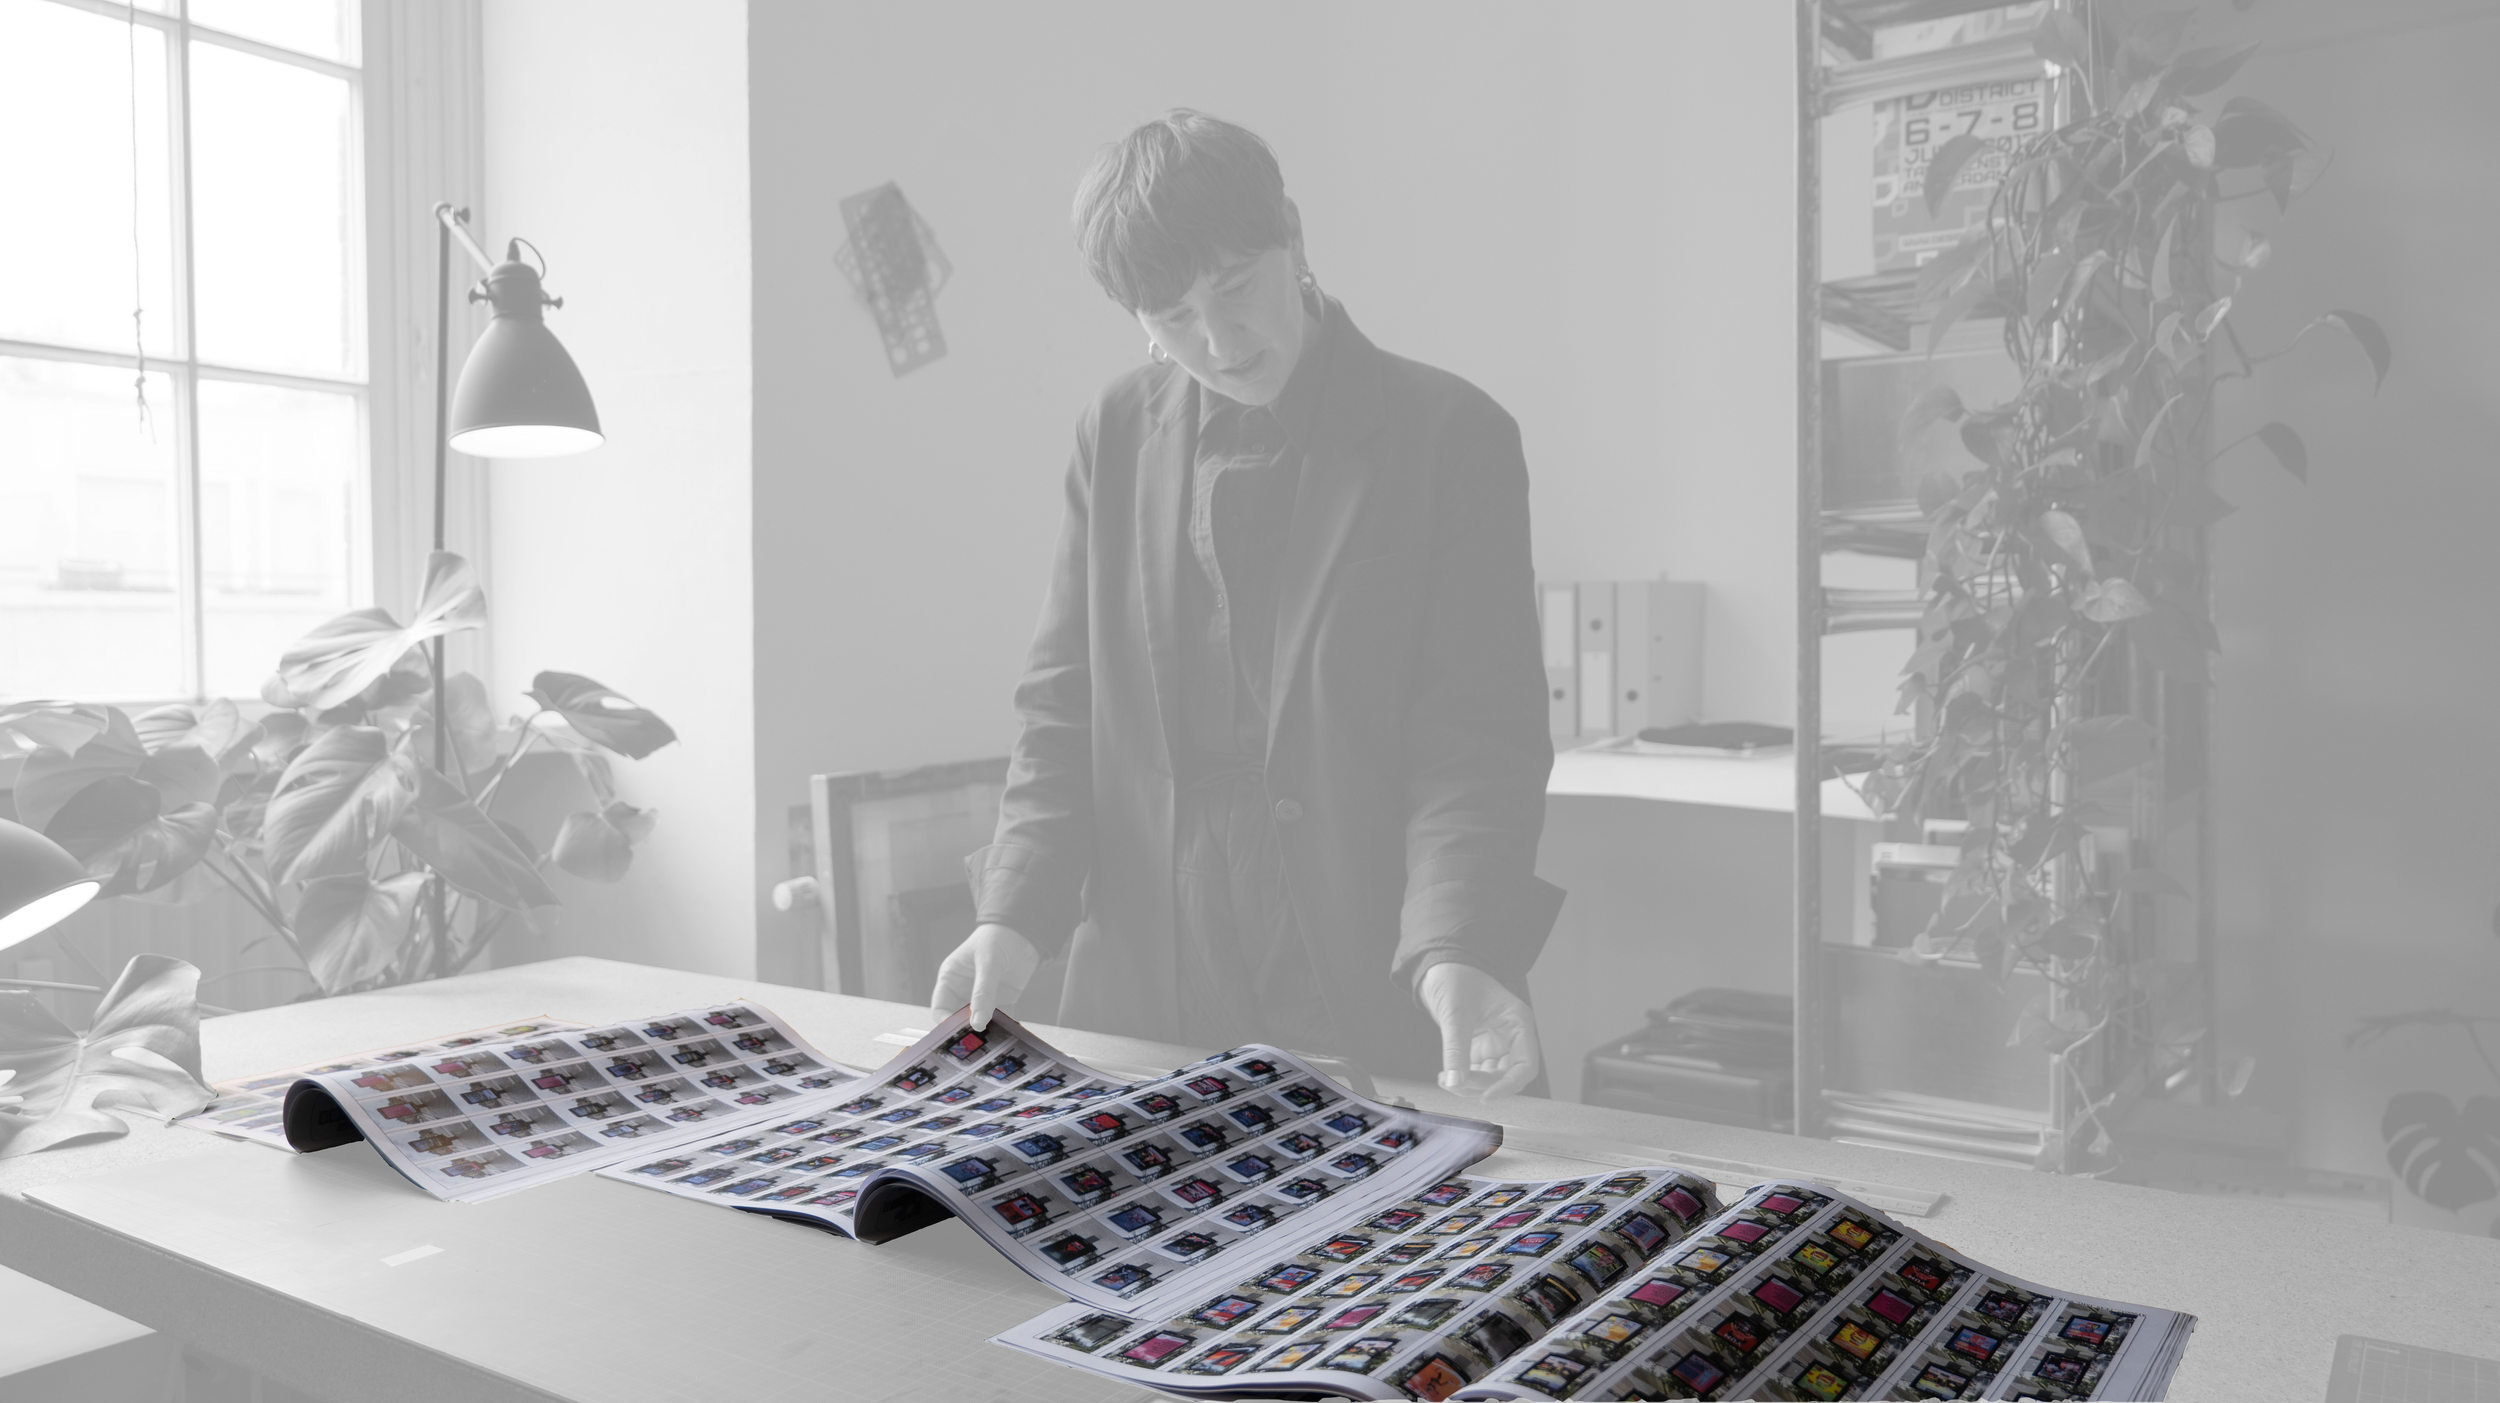
Three visual indexes were produced, one for each day of fieldwork. Each index documents the same twenty digital Mupis, both sides captured, forty sides per index. Across the three indexes, this totals sixty double-sided recordings of the same twenty objects, allowing direct comparison of how content, sequencing and repetition shift across sessions.